
If there is something strange in the neigborhood, and it don’t look good. Who you gon’ call? More data!
I conducted the Disable Wi-Fi when inactive experiments I was talking in part 2 but unfortunately they yielded strange figures.
Experiments
Here briefly the data I collected
Experiment 4 - WiFi on - AutoDisable: on - Brightness level: 6 - 32 minutes
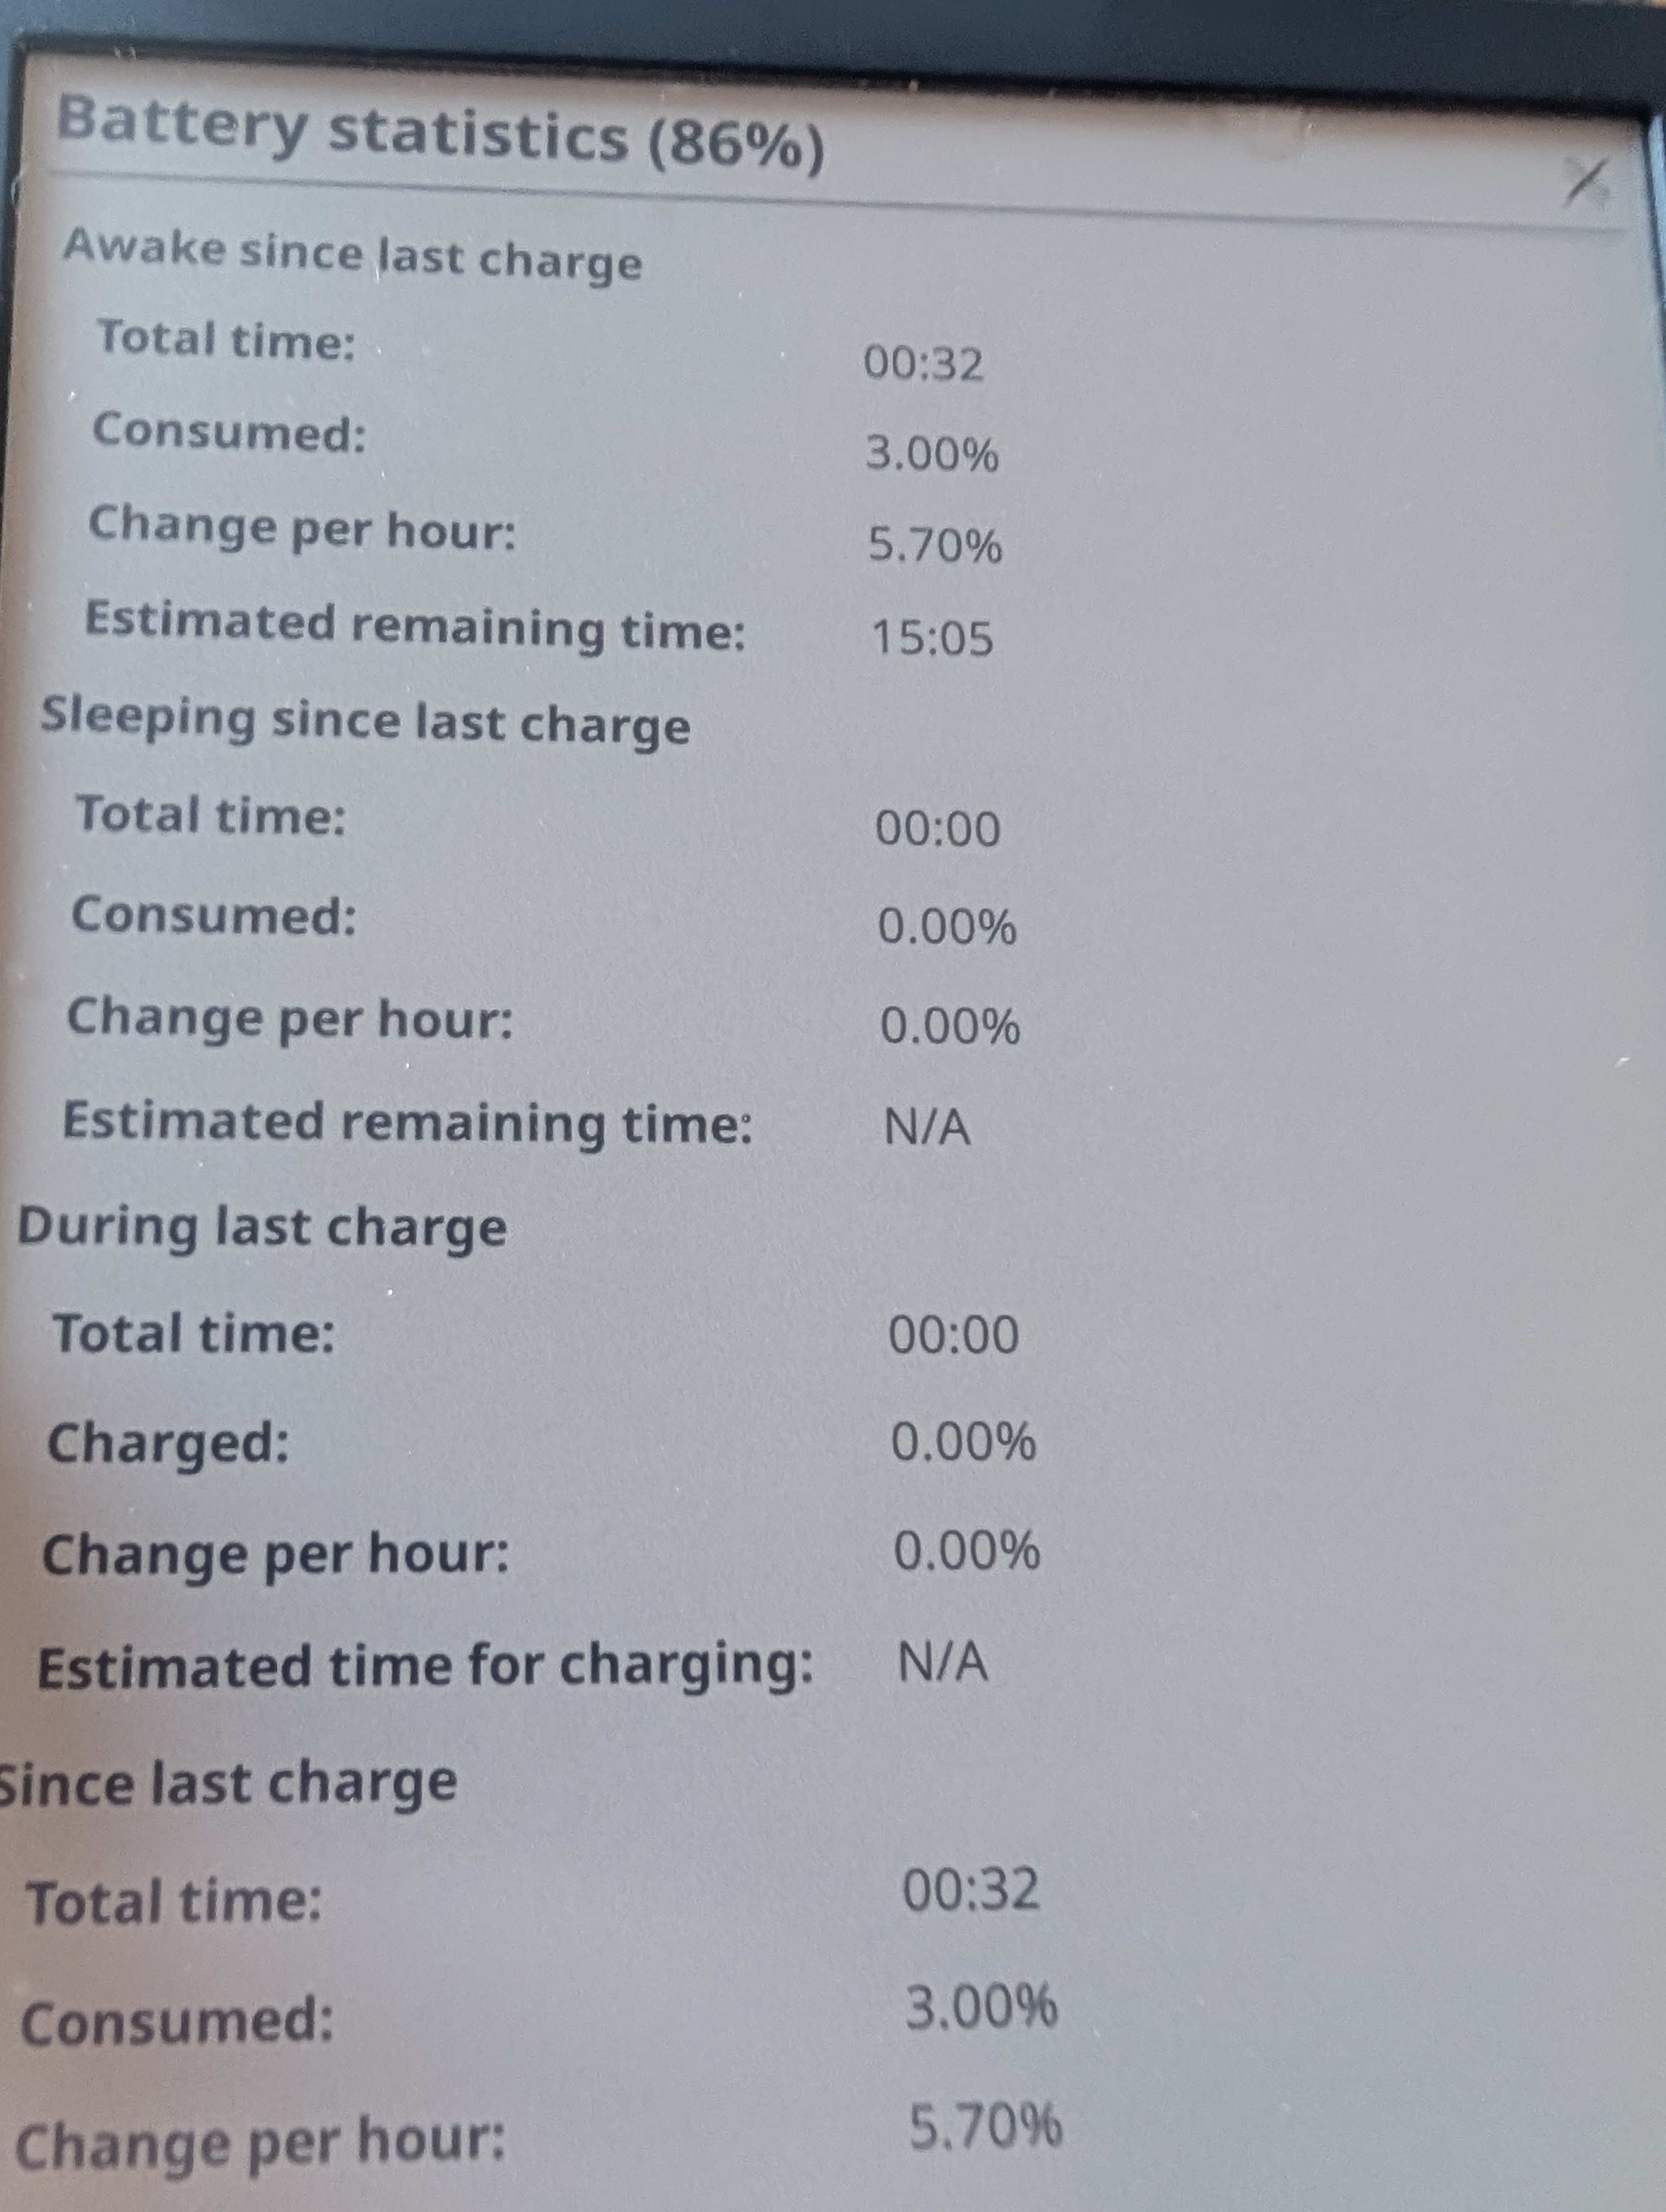
Roughly the same consumption as before, strange, so I decided to slip in another session.
Experiment 5 - Wifi on - Auto Disable: on - Brightness level: 6 - 01:09 hours
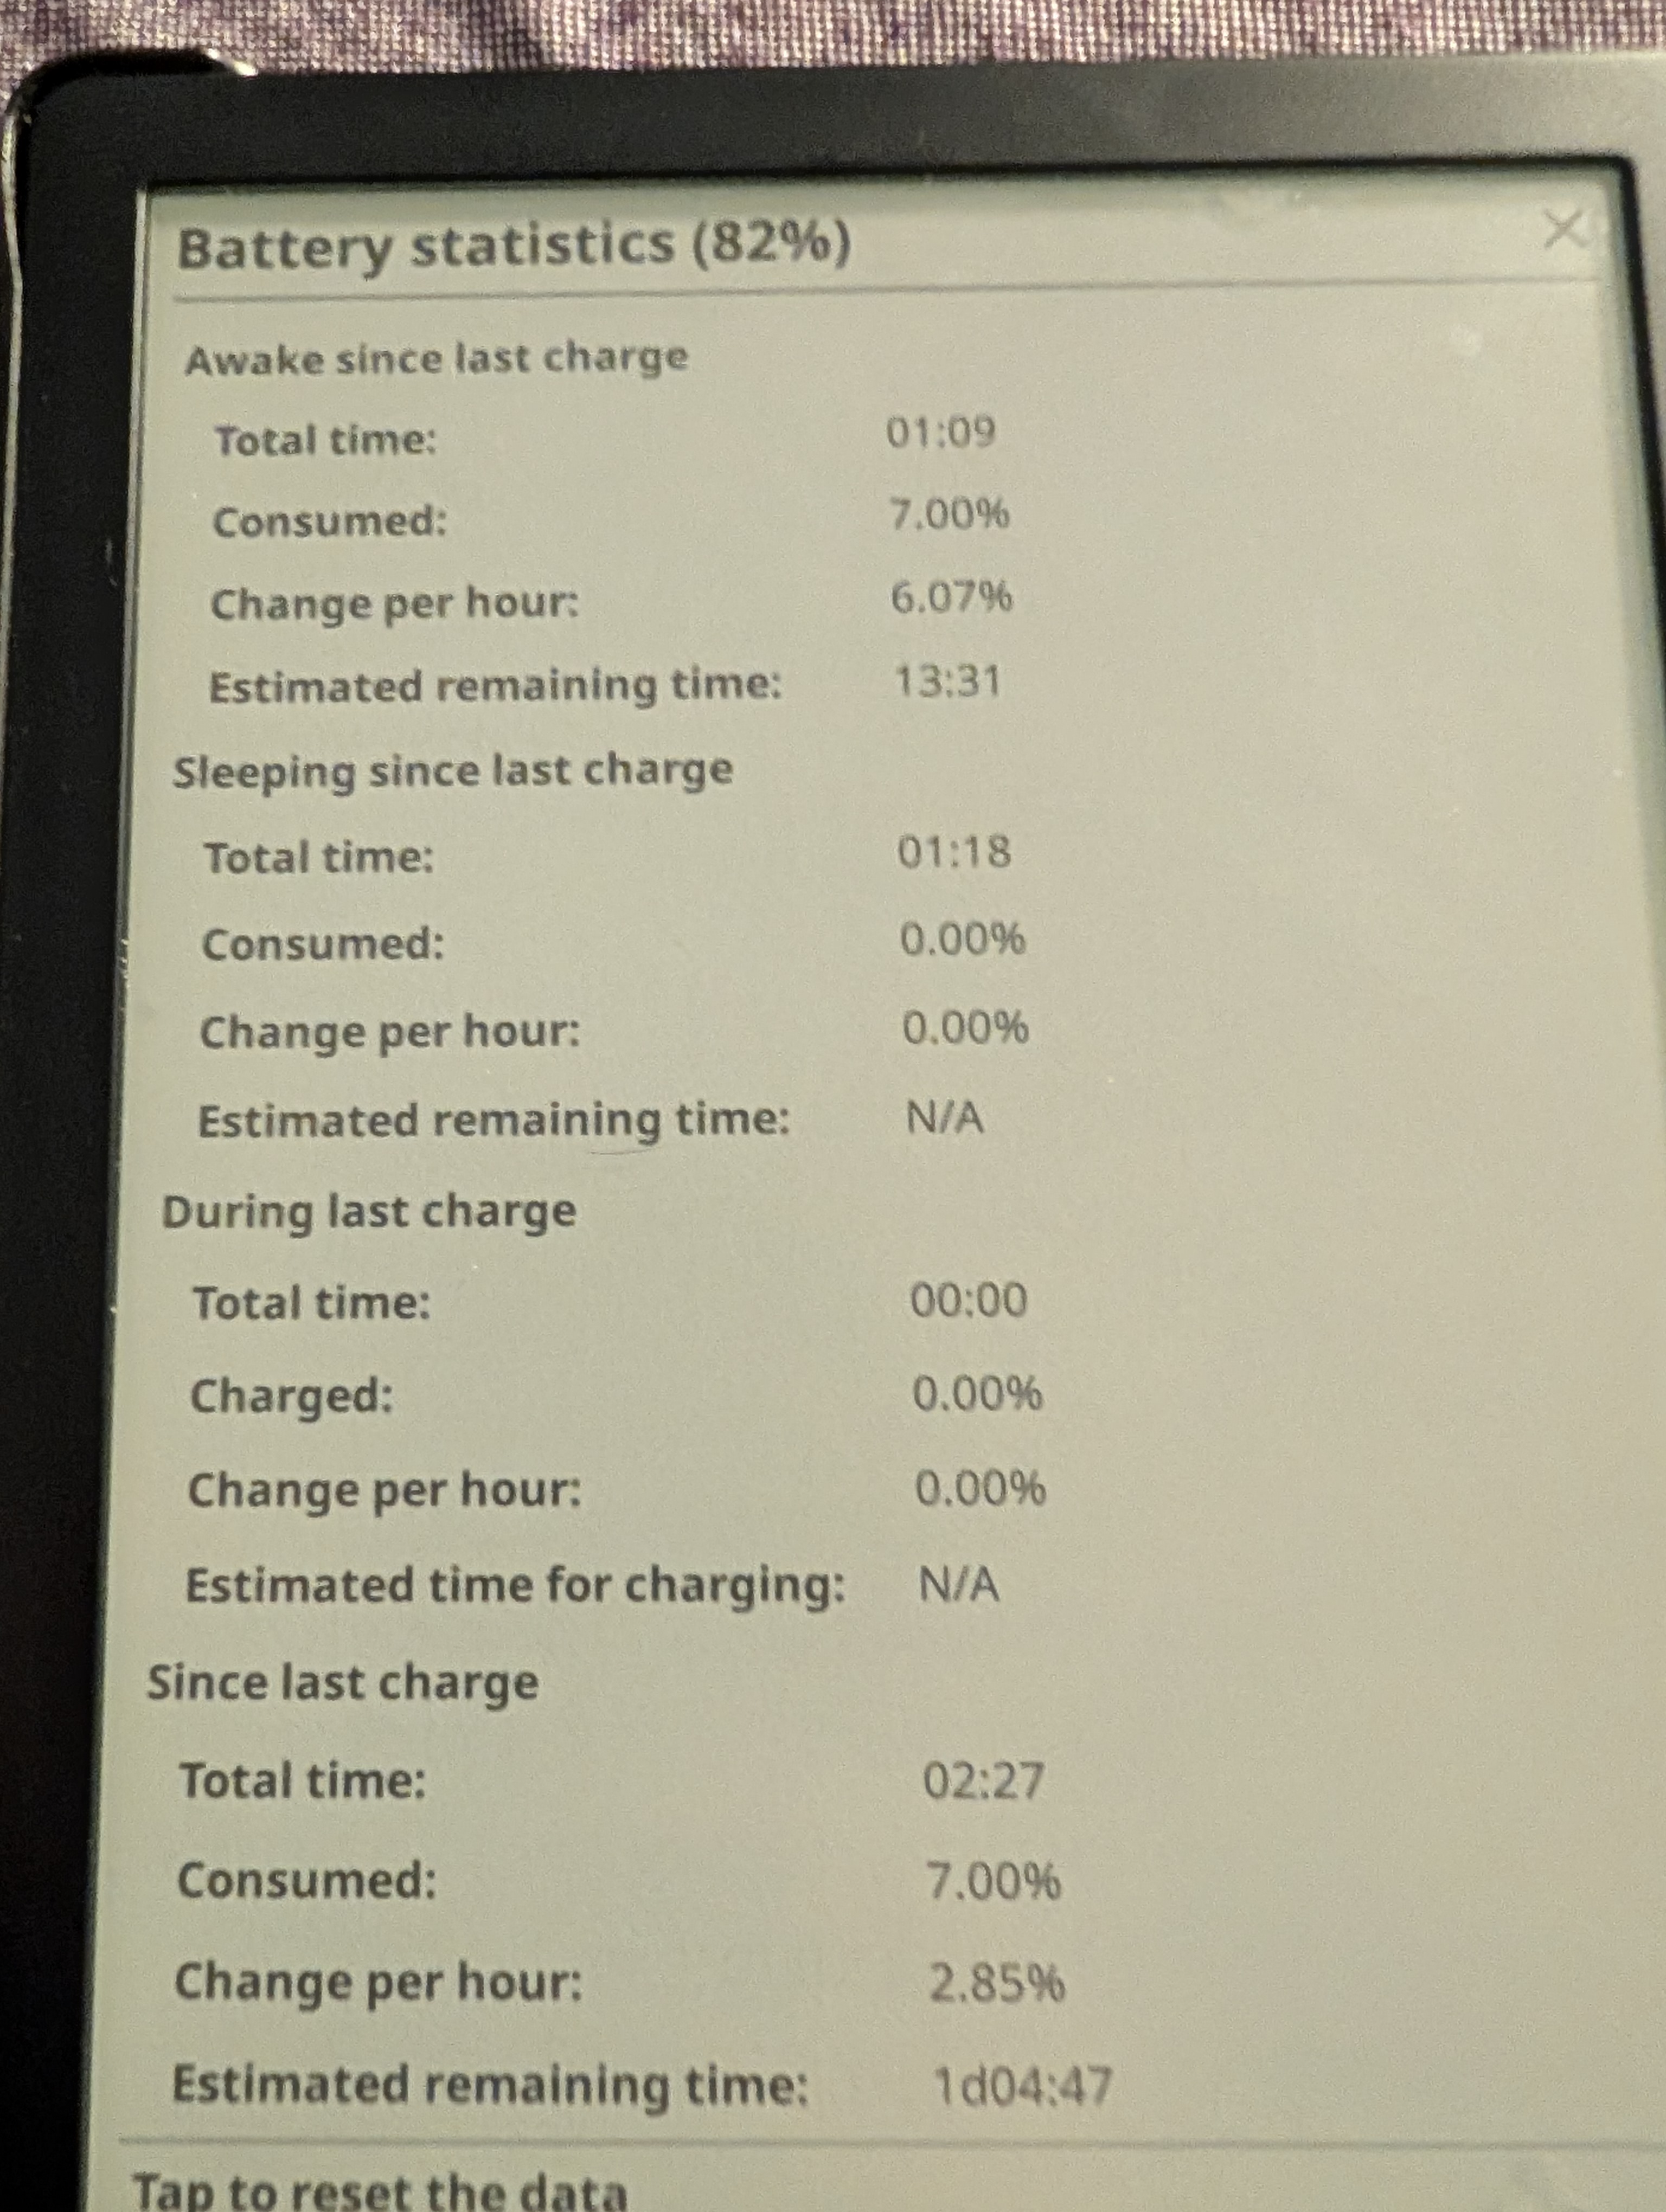
6.07% it didn’t seem to work at all. So I decided to toggle the setting off.
Experiment 6 - WiFi on - AutoDisable: off - Brightness level: 6 - 54 min
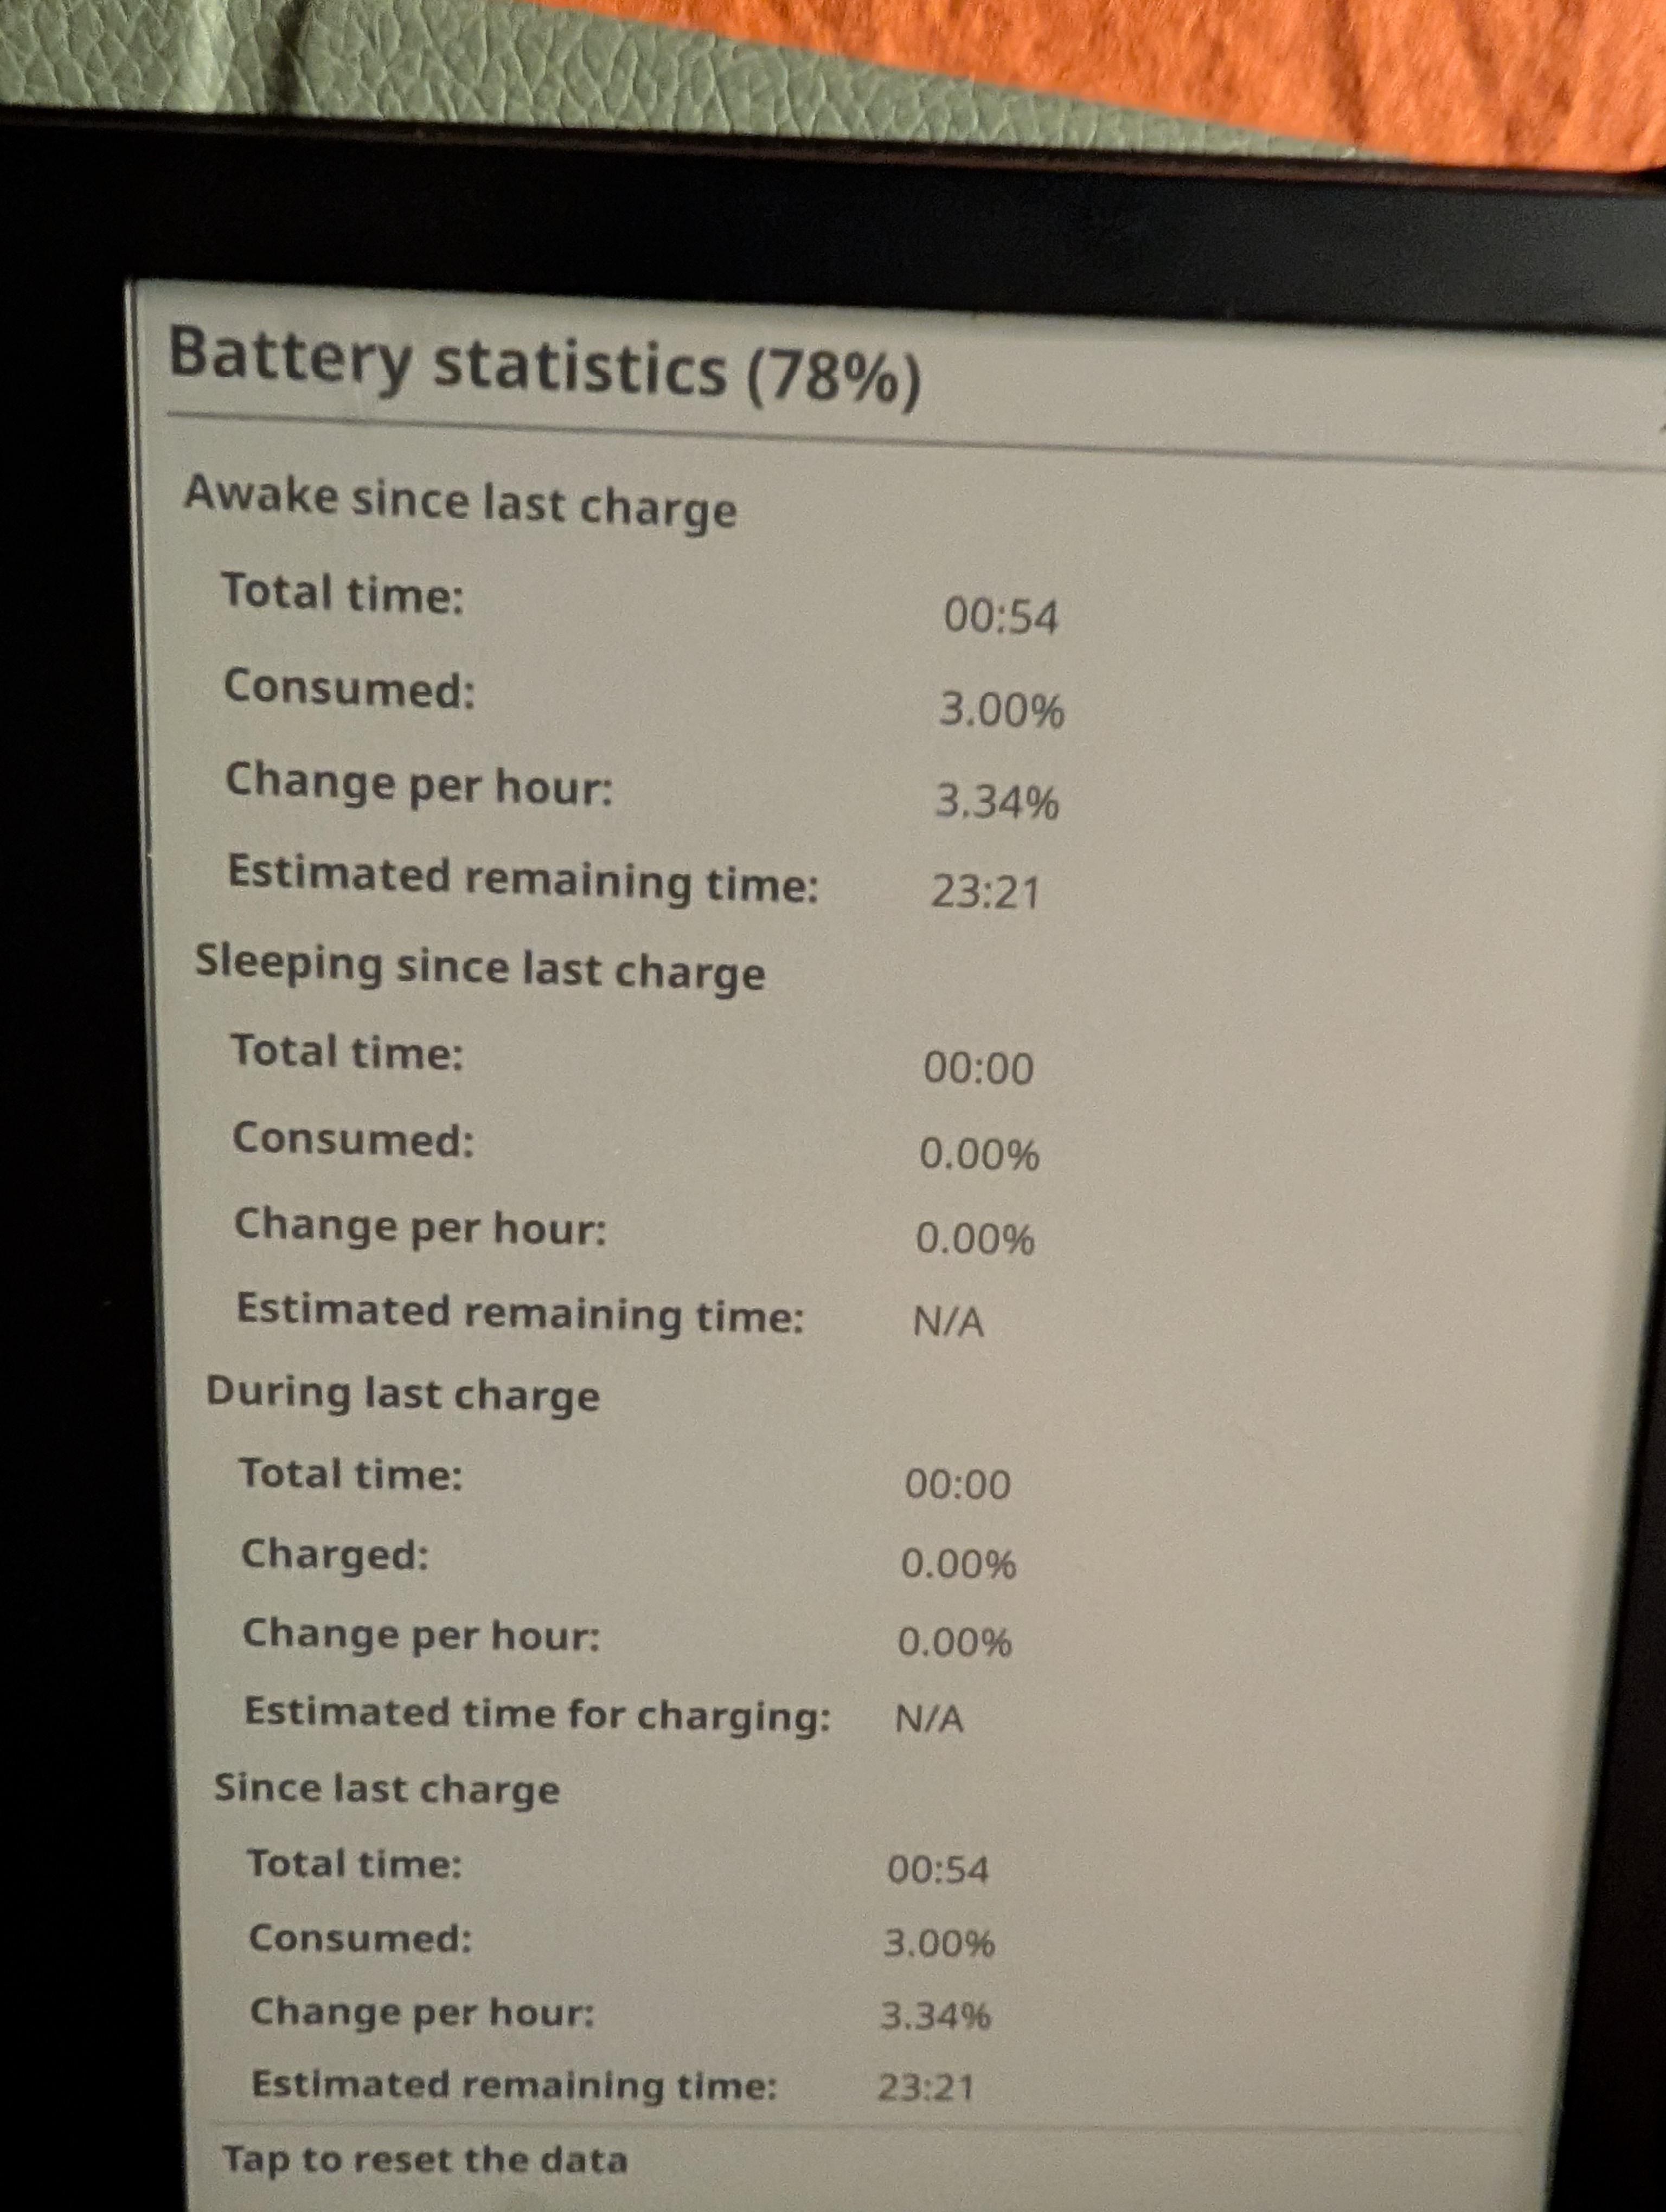
This time it reported 3.34% what I was expecting with the other two experiments. Since I started being confused by this data, I jotted down a cleaner and stricter protocol to perform the next tests.
The protocol
Pre-experiment setup
Disable everything that could introduce activity or wake the device mid-test:
Settings→Network→Restore Wi-Fi connection on resume- off- Any plugin with autosync: kosync auto progress sync, Wallabag auto-sync, News downloader auto-download, Calibre wireless — turn all off
autodimplugin — turn off- Auto standby / auto suspend — set both timeouts to off/disabled, not just “long”
- Frontlight: fixed brightness, same level every trial (e.g. level 6)
Constants across all trials:
- Same book, same page.
- Same physical location (Wi-Fi signal strength affects radio power draw).
- Device left completely untouched for the full duration once started .
How to take measurements
The battery_statistics menu item (from the batterystat plugin) has a “Tap to reset the data” action that zeroes its accumulated history and starts timing fresh from the current percentage. It already separates awake-discharging from sleeping-discharging, so a stray suspend won’t pollute the awake drain rate.
- Wake the device (if it was asleep), let it settle for a bit — this also lets any Wi-Fi (re)connection transient finish — then tap reset. Whatever happened between waking and the reset (including the connection tax) is excluded from the measured window.
- For condition C only: keep that wait short. The auto-disable watchdog kills Wi-Fi after ~5 minutes of no traffic. If you wait longer than that before resetting, Wi-Fi will already be off when the window starts, and the trial will just look like condition B — defeating the point of testing C. Reset soon after connecting, well before the 5-minute mark, so the measured window still captures the on-to-auto-off transition.
- Same fixed duration for every trial (e.g. 60 min) — removes the extrapolation-noise problem from earlier tests.
Next steps
With my shining new protocol I designed a new experiment, composed of three conditions.
Condition A — Wi-Fi always on (baseline ceiling)
- Connect Wi-Fi manually via the network menu.
- Confirm “Disable Wi-Fi when inactive” is off.
- Let the connection settle, then reset Battery statistics.
- Wait exactly N minutes (same fixed duration for all trials — 60 min is clean).
- Check Battery statistics for the awake-discharging rate. Don’t touch anything in between.
Condition B — Wi-Fi off the whole time (baseline floor)
- Turn Wi-Fi off manually via the network menu (interactive toggle, a deliberate off, not the watchdog).
- Reset Battery statistics, start timer for the same N minutes.
- Check Battery statistics at the end.
Condition C — Wi-Fi on, “Disable Wi-Fi when inactive” enabled (the thing to test)
- Turn the setting on, restart KOReader (or reconnect Wi-Fi once) so the watchdog actually arms.
- Connect Wi-Fi manually.
- Reset Battery statistics soon after connecting (see note above — don’t wait past ~5 minutes), start timer for the same N minutes.
- Midway check (optional): open Network info once, briefly, to confirm Wi-Fi actually got disabled by the watchdog. Adds negligible traffic but confirms the mechanism engaged. Skip for a zero-touch run if preferred.
- Check Battery statistics at the end.
Expected result if the mechanism works as designed
- A (always on) should show the highest drain.
- B (always off) should show the lowest.
- C should converge close to B once the watchdog kills Wi-Fi (~5 min in), so its total should sit near B, not near A — with the small difference being the cost of the initial few minutes of association plus the eventual one-time teardown.
If C instead lands close to or above A consistently across multiple repeats, that’s a real finding worth digging into further.